Design the Business Intelligence Dashboard for the Purpose
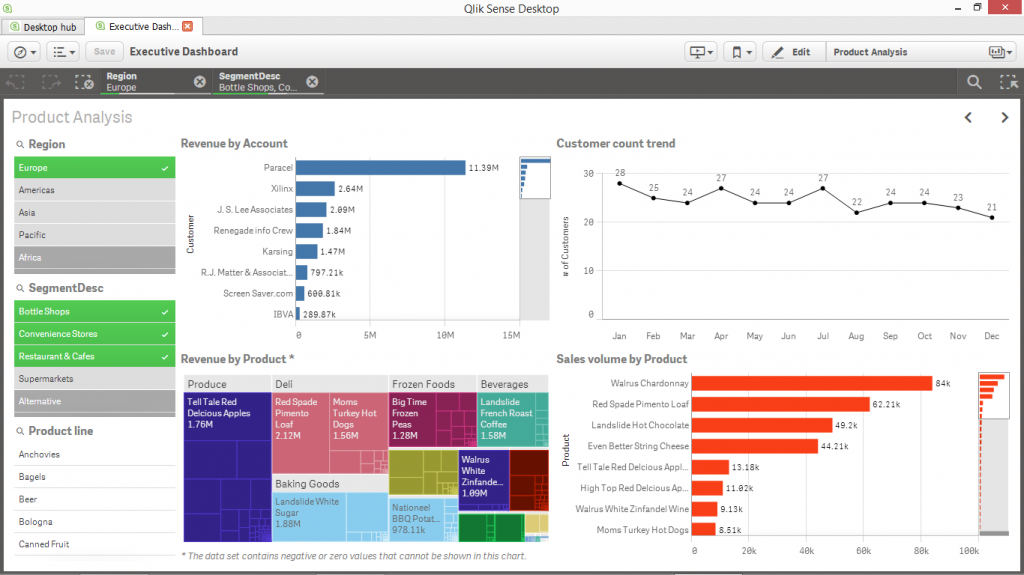
Business Intelligence (BI) dashboards can be designed to present as much or as little information as required in any number of presentations from data visualizations to straight tables and pivot tables. From a design perspective, it’s best to group dashboards into specific kinds of dashboards based on the intent and operations looking to leverage business intelligence.
From a high level perspective, dashboards can be broken down into three distinct types as follows.
- Strategic
- Tactical
- Operational
Strategic dashboards are typically highly summarized, highly graphical and or less frequently updated. They can include global, external, trend, and growth measures. Strategic dashboards are designed to monitor progress toward enterprise strategic objectives and key performance indicators (KPIs). Strategic dashboards can be designed to have visibility down to the department level so to avoid creating multiple strategic versions and to monitor the execution of the enterprise strategic objectives at the departmental level.
Tactical dashboards are designed to monitor progress of each of the strategic goals and initiatives. They can include key projects that are the drivers beyond the strategic goals and are often measured against a preset goal (i.e. budget or target). For example, if the strategic goal is to increase the number of customers over the next fiscal year by 20%. A tactic to execute on that strategic goal could be to dramatically increase social media marketing. A tactical dashboard would be designed with analytics that monitor the effectiveness of the social media campaigns in support of the strategic goal of obtaining 20% more customers. Tactical and operational dashboards are ideally deployed with a technology that allows for drill down and around commonly referred to as “slicing and dicing” the data.
Operational dashboards are used to monitor operational processes and activities. These dashboards have a higher refresh rate commonly ranging from weekly to near real time. As these dashboards report at the transactional level, commonly used objects include charts, reports, pivot tables and ad hoc reports. If the operational dashboard is designed well, managers will rely on them to alert them of issues, as they happen, so to address them in a timely manner to minimize unintended costs or leverage an opportunity to improve workflow. Operational dashboards are inherently designed for use at the departmental level where production or workflow takes place.
Implementing a software solution, whether it’s a BI, ERP or CRM solution, begins with the approach. Project planning is critical to implementing a software solution. There are a variety of planning approaches to implementing BI dashboards and no one approach is better than any other. However, from an information flow perspective, it is usually advisable to start where visibility or access to actionable information is challenging. Implementing a BI dashboard to fill those reporting gaps is a value adding way of introducing an organization to the power of business intelligence reporting for gaining insight and visibility into the business.


